How ThemeHive Technologies Builds Smart Dashboards
Introduction
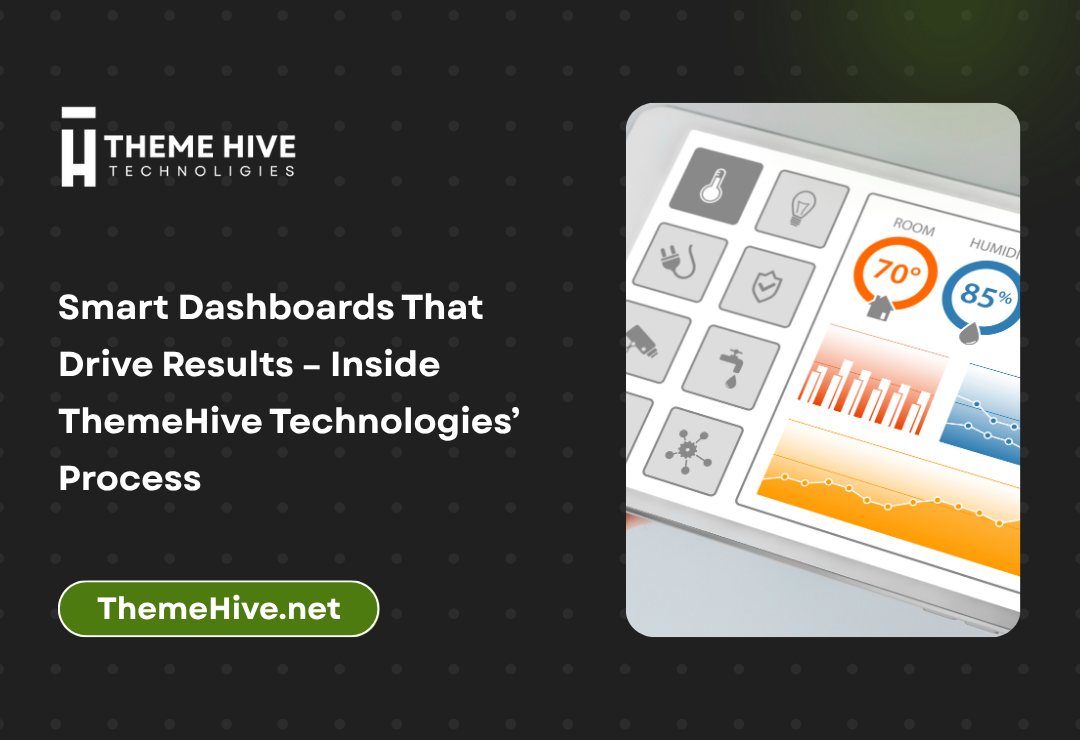
In today’s data-driven business environment, smart dashboards are essential tools for turning raw data into actionable insights. At ThemeHive Technologies, we specialize in creating intelligent, intuitive, and interactive dashboards tailored to meet diverse industry needs. This article explores our comprehensive approach to building smart dashboards that drive better decisions, improve performance tracking, and ensure seamless user experiences.
What Are Smart Dashboards?
Smart dashboards are dynamic, real-time interfaces that consolidate complex data into a visually coherent format. They go beyond static charts by integrating data analytics, predictive insights, and automated alerts to enable proactive decision-making.
Core Features of ThemeHive’s Smart Dashboards
1. Real-Time Data Integration
We build dashboards that pull in live data from multiple sources like CRMs, ERPs, IoT devices, and APIs. This ensures users always have the latest insights at their fingertips.
2. Custom Visualizations
Our dashboards include a wide variety of chart types: line, bar, pie, heatmaps, geospatial maps, and more. We tailor each visualization to highlight the most relevant KPIs.
3. Role-Based Access
ThemeHive Technologies implements robust permission structures, allowing stakeholders to see only the data that matters to them.
4. Predictive Analytics and AI
We use machine learning algorithms to uncover patterns, trends, and forecasts, adding intelligence to every dashboard.
5. Mobile Optimization
Our smart dashboards are fully responsive, giving users seamless access across all devices — desktops, tablets, and smartphones.
Our Development Process
Step 1: Requirement Analysis
We work closely with clients to understand their goals, user types, and key performance metrics.
Step 2: Data Architecture Planning
We identify data sources and design a structure that enables fast, scalable access and processing.
Step 3: UX/UI Design
Using modern design tools, our team crafts an intuitive and engaging user interface focused on clarity and usability.
Step 4: Backend & Frontend Development
We use frameworks like React, Angular, Node.js, and Python to develop a high-performing application.
Step 5: Testing and QA
Our QA engineers perform rigorous testing — functional, security, and usability — before deployment.
Step 6: Training & Deployment
We onboard the client’s team and offer ongoing support to ensure they get the most from their dashboards.
Technologies We Use
- React & Angular for UI
- D3.js & Chart.js for advanced visualizations
- Python & Node.js for backend services
- MongoDB, PostgreSQL for data management
- AWS, Azure for cloud hosting
Business Benefits of Smart Dashboards
Enhanced Decision-Making
Data presented clearly enables faster and more confident decisions.
Increased Productivity
Automated reports and alerts reduce manual work.
Improved Collaboration
Shared access and insights across departments improve alignment.
Real-Time Monitoring
Track KPIs, service levels, and anomalies as they happen.
Scalability
Our dashboards grow with your business, adapting to new data sources and user needs.
Use Cases by Industry
Healthcare
- Patient monitoring dashboards
- Hospital KPI analytics
E-commerce
- Sales conversion tracking
- Inventory heatmaps
Finance
- Fraud detection panels
- Expense and revenue forecasting
Education
- Student performance tracking
- Curriculum engagement insights
Why Choose ThemeHive Technologies for Smart Dashboards
1. Tailored Solutions
Every dashboard we build is designed around your specific use case.
2. End-to-End Services
From ideation to support, ThemeHiveTechnologies handles the full lifecycle of dashboard development.
3. Secure and Compliant
We follow industry best practices in data security and compliance.
4. Scalable Architecture
Our systems are built to handle growing data loads and user bases.
5. Ongoing Support & Maintenance
We provide continuous updates, maintenance, and feature enhancements.
How Smart Dashboards Enhance Business Intelligence
Smart dashboards act as a visual gateway into business intelligence platforms, allowing teams to:
- Track OKRs and KPIs
- Analyze historical trends
- Discover performance bottlenecks
- Generate custom reports
Integrating Dashboards with Other Systems
ThemeHive Technologies ensures smooth integration with:
- ERP systems (SAP, Oracle)
- CRMs (Salesforce, HubSpot)
- Marketing platforms (Google Analytics, Mailchimp)
- Databases (SQL, NoSQL)
SEO and Analytics Integration
Our dashboards often include modules for:
- SEO performance tracking
- Web traffic segmentation
- Campaign ROI
Internal Links
To learn more about our expertise, visit:
External References
Conclusion
Smart dashboards are more than just data visualization tools — they’re the cornerstone of modern, agile business operations. With ThemeHive Technologies, you’re not just getting a dashboard; you’re getting a strategic tool that aligns your data with your business goals. Whether you need a solution for finance, healthcare, or e-commerce, our custom smart dashboards bring clarity and insight to every decision you make.
Ready to transform your data into strategic intelligence? Contact ThemeHive today to get started.


